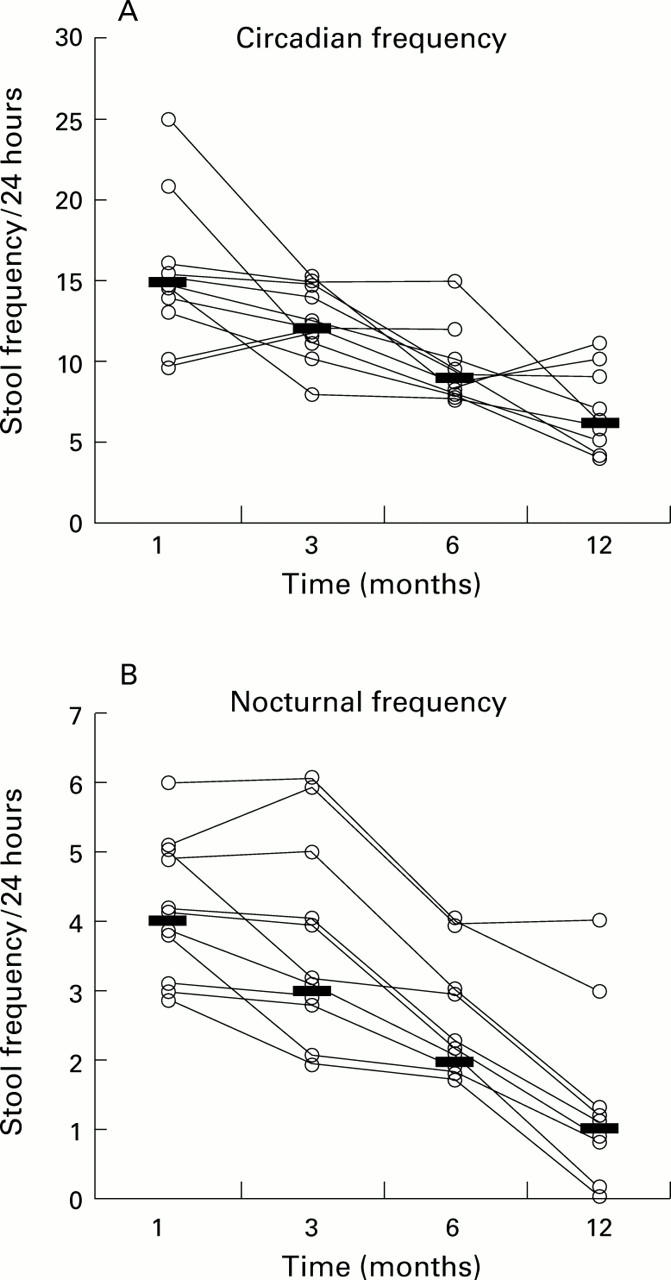
Figure 2 .

(A) Total stool frequency over 24 hours for each patient. The number of stools per 24 hours decreased significantly during follow up (Friedman test, p<0.0001). (B) Stool frequency at night for each patient. Nocturnal stool frequency decreased significantly during follow up (Friedman test, p<0.0001).
