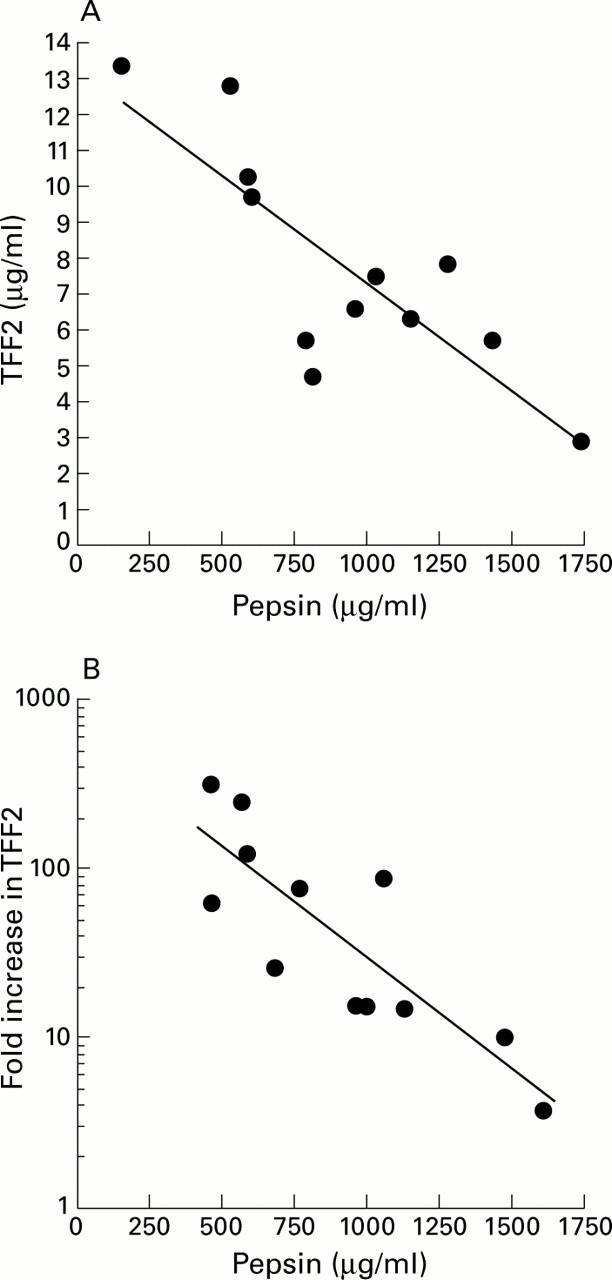
Figure 7 .

Relationship between pepsin activity and TFF2 concentration in individual gastric juice samples. (A) Gastric juice was collected from 12 young healthy volunteers at 7:00 am. TFF2 concentrations and pepsin activities in gastric juice were measured as described in the methods. Values for TFF2 concentration in gastric juice from each individual are shown plotted against pepsin activity. (B) Gastric juice was collected from 12 young healthy volunteers at two hourly intervals between 7:00 pm and 7:00 am. TFF2 concentrations and pepsin activities in gastric juice were measured as described in the methods. The fold increases in TFF2 concentration over this time were calculated and are plotted against the average pepsin activity for each individual.
