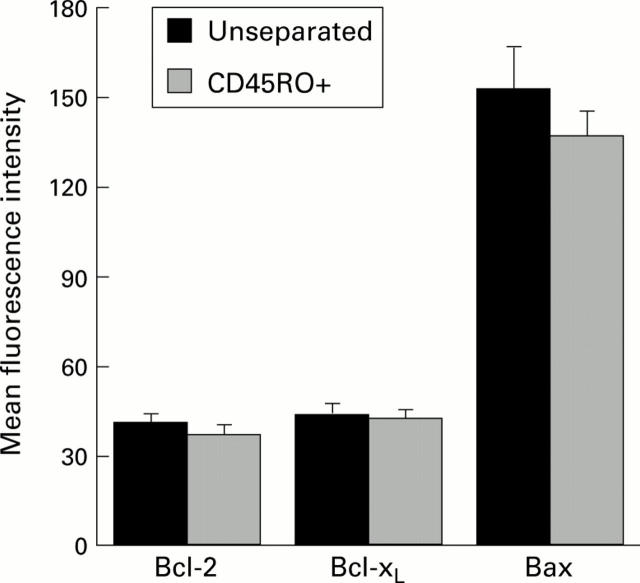
Figure 3 .
Flow cytometric analysis of intracellular staining for Bcl-2, Bcl-xL, and Bax protein levels in normal unseparated and CD45RO enriched (+) peripheral blood T cells (PBT). Results are mean (SEM) fluorescence intensity for eight PBT isolates. No statistically significant differences were observed for Bcl-2, Bcl-xL, and Bax.

