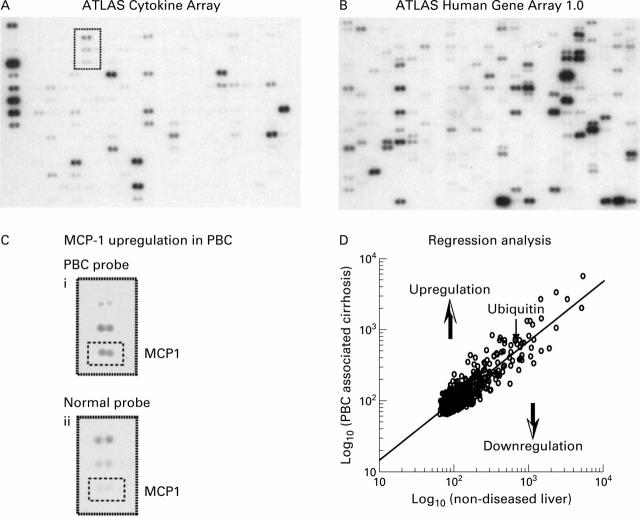
Figure 1 .
Examples of cDNA arrays. ATLAS Cytokine Receptor Array (268 genes and nine housekeeping genes) (A) and ATLAS Human Gene Array 1.0 (588 genes and nine housekeeping genes) (B), both probed with 32P-2' deoxy-cytidine 5' triphosphate (dCTP) labelled primary biliary cirrhosis (PBC) mRNA (pooled from four subjects). The magnified portion of the ATLAS Cytokine Receptor Array compares the 32P-dCTP signal from the PBC and normal liver probes. Upregulation of monocyte chemoattractant protein 1 (MCP-1) in PBC (in the small broken line boxes) is shown (C). Regression analysis (D); this example compares signals generated using the PBC probe with signals generated using a probe derived from non-diseased tissue (the normal liver probe) for each gene on the ATLAS Human Gene Array 1.0. The regression line equation was PBC=2.0684×non-diseased0.83854, r2=0.76, p<0.0001. The extent of differential expression for each gene was determined as a ratio of the raw array signal intensity to the signal intensity calculated from the regression line formula.

