
Figure 2 .
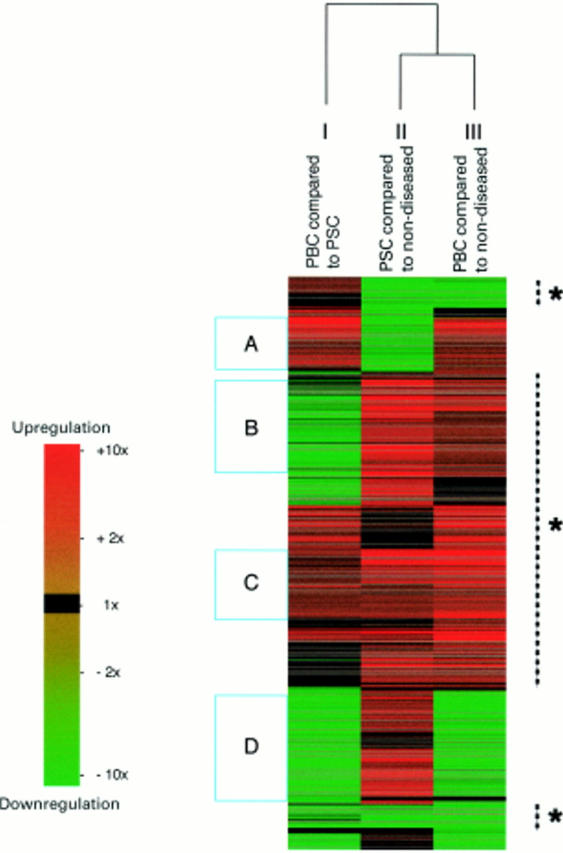
Clustering of the 874 genes. Each line across all comparisons represents a single gene with upregulation indicated in increasing red and downregulation indicated in increasing green. Genes were clustered according to the nature and extent of their differential expression over the three comparisons. There was more than 70% similarity in the patterns of expression in primary biliary cirrhosis (PBC) and primary sclerosing cholangitis (PSC) associated cirrhosis compared with non-diseased tissue (indicated by the broken lines with asterisks). This graphical depiction of the data identifies groups of genes, such as those that had increased expression in: PBC compared with both non-diseased tissue and PSC associated cirrhosis (A); both PBC and PSC associated cirrhosis compared with non-diseased liver (B, C); PBC compared with PSC associated cirrhosis in addition to both of these diseases compared with non-diseased liver (C); and PSC but not PBC compared with non-diseased liver (D).