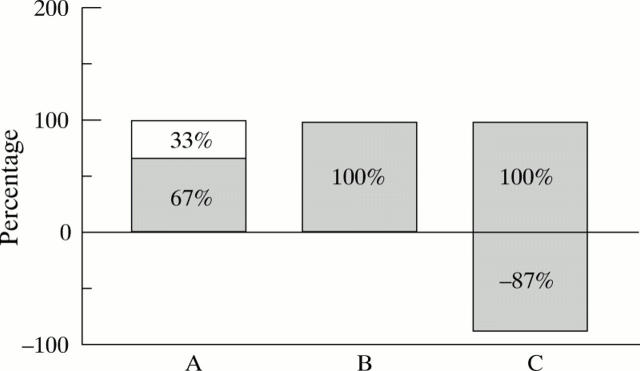
Figure 3 .
This bar graph represents the average percentage plaque contribution (grey bar) and the percentage remodelling contribution (white bar) to the luminal area at the lesion site by intravascular ultrasound in the different three remodelling groups. (A) shrinkage; (B) non-remodelling; (C) compensatory enlargement group. In group A, 67% of the luminal area decrease was contributed by plaque. The remaining 33% luminal area decrease was attributed to paradoxical shrinkage of the lesion. In group B with no remodelling, the stenosis was formed alone by plaque. In group C, plaque contribution was 187% caused by compensatory enlargement of 87% in lumen area.

