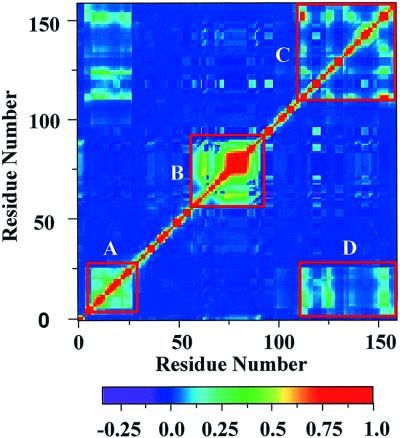
Figure 2.
Calculated RSC for each pair of residues in DHFR. Red corresponds to a large positive energetic connectivity, blue to the smallest connectivity, and purple to a negative energetic connectivity, as indicated in the color bar. Residues 1–34 (labeled A), residues 60–90 (labeled B), and residues 110–159 (labeled C) each behave cooperatively. Additionally, residues 1–34 and 110–159, although distal in sequence, are also positively cooperative (labeled D).

