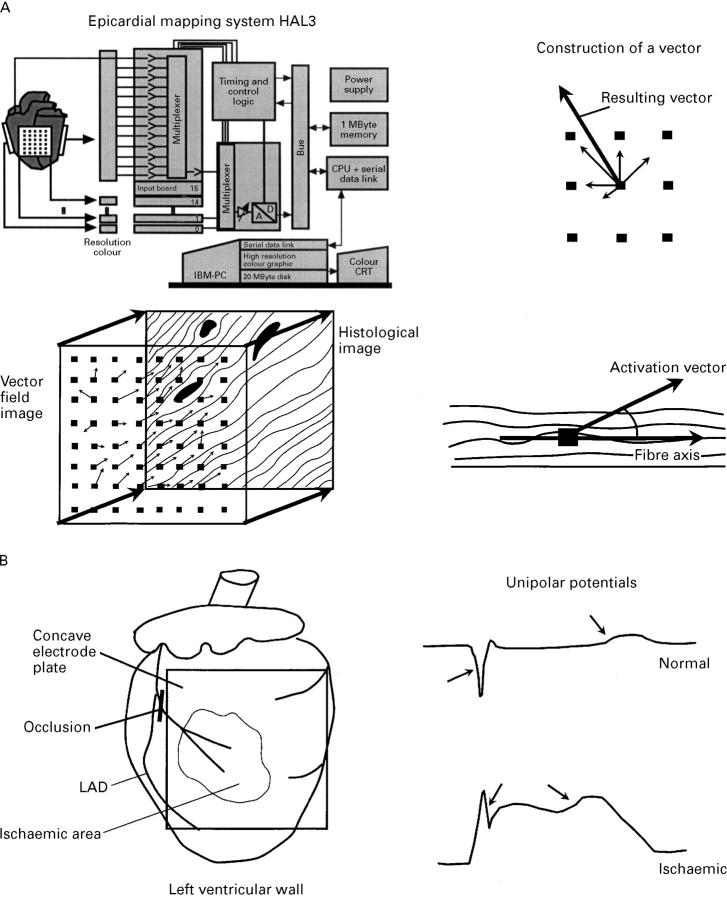
Figure 1 .
(A) Schematic representation of the experimental setup and analysis. Left upper panel: mapping system with 256 unipolar electrodes. Right upper and lower panels: the principle of vector construction: from the activation time and position of the central electrode and those electrodes, which were activated after the central electrodes, vectors were calculated and added to produce a resulting vector giving the direction and apparent velocity of the local activation. Left lower panel: projection of the resulting vector field on the composed histological image, with the construction of the angle between the fibre axis and the local activation vector. (B) Left panel: position of the concave electrode plate in relation to the ischaemic zone and the occlusion of the left anterior coronary artery branch. Right panel: typical unipolar potentials, with indication of the activation time point (determined as time point of dU/dtmin) and the repolarisation time point (determined as the time point of dU/dtmax). For details see Methods.

