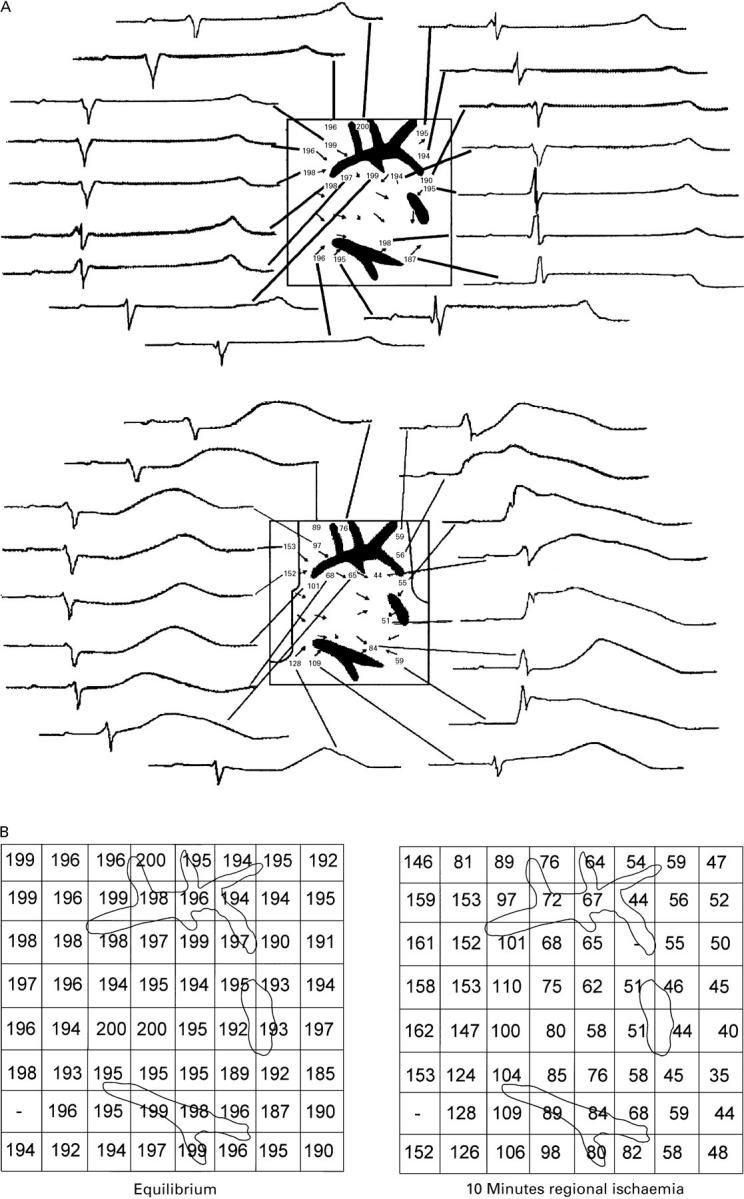
Figure 2 .

(A) Graphically reproduced images of the left ventricular wall during control (upper panel) and after 10 minutes of regional ischaemia (lower panel) in a typical experiment. The square represents the shape of the electrode grid, while black areas represent vessel sections. Numbers indicate the activation-recovery interval (ARI) in ms at that particular electrode. Vectors show local velocity and orientation of the propagating wave front at that point. Around the grid, original recordings of the unipolar ECGs of the respective electrode are displayed. The ischaemic border zone is represented as a black line in the lower part of the figure. The formerly homogeneously distributed ARI, which resemble each other closely in morphology, change to heterogeneous ARI with different morphology; the most pronounced shortening is in the direction of the propagating wavefront behind the vessel reflected by a shifted T wave in the ECG to the left and a less pronounced shortening directly in front of the vessel in the direction of the wavefront. Total activation time under control conditions was 5 ms , and after 10 minutes of ischaemia, 11 ms . (B) Left panel: ARI of the left ventricular wall under equilibrium conditions. Right panel: ARI of the left ventricular wall after 10 minutes of regional ischemia. The location of the vessels as seen in the histological image are displayed.
