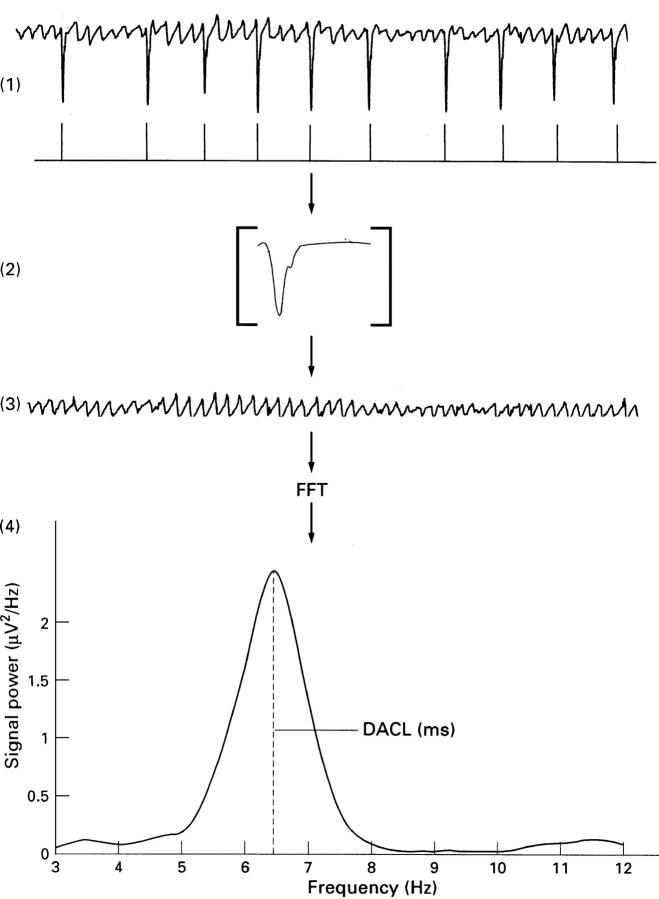
Figure 1 .
Schematic illustration of the different steps of the FAF-ECG method. (1) Low frequency components were reduced using a linear phase high pass filter. (2) Classification and subtraction of QRST complexes from the original ECG signal. (3) A frequency spectrum was estimated from the residual ECG signal using the fast Fourier transform technique (FFT). (4) The peak frequency of the dominating frequency components between 3 and 12 Hz was estimated, corresponding to the dominant atrial cycle length (DACL).

