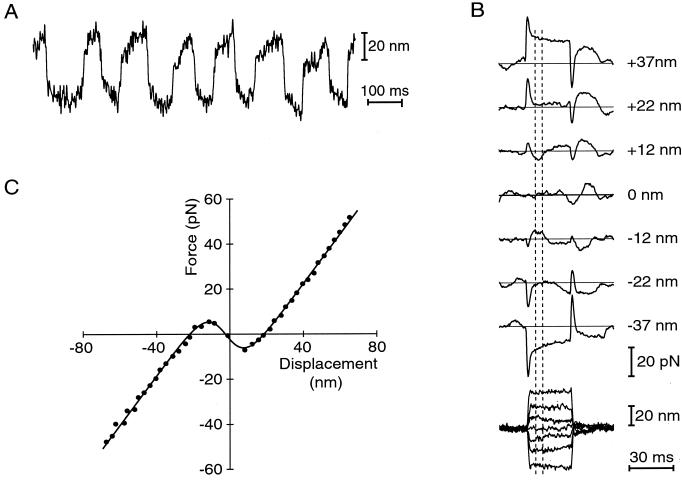
Figure 1.
(A) Spontaneous oscillation at ≈7 Hz of a hair bundle from the bullfrog's sacculus. Note the alternation between slow bundle movements and rapid strokes in the opposite direction. (B) Measurement of the relation between hair-bundle displacement (lower family of traces) and applied force (upper traces). Under displacement-clamp conditions, a bundle was deflected distances up to ±70 nm in steps of ≈5 nm. Seven typical responses are plotted, each an average of 20 repetitions; the corresponding hair-bundle displacements are given to the right. A step command initially evoked a viscous-force transient in the direction of bundle movement; the force then changed slowly as the bundle adapted to its new position. The elastic response of the hair bundle was measured soon after the viscous response had vanished but before adaptation had progressed significantly; the measurement window of 5–10 ms from the onset of the stimulus is enclosed by vertical dashed lines. For displacements of ±12 nm, the direction of bundle displacement was opposite in sign to the force applied; the bundle's chord stiffness, FSF/X, was therefore negative. Almost no force was required to displace the bundle by ±22 nm. Finally, at ±37 nm, the bundle behaved as an ordinary spring with positive stiffness. (C) Displacement-force relation measured under displacement-clamp conditions. Each point represents a bundle displacement and the corresponding force exerted by the fiber, as averaged over the time window designated in B. The continuous curve is the best fit of the data by Eq. 2, for which Κ∞ = 1,090 μN⋅m−1, N = 65, z = 0.72 pN, F0 = 25 pN, and X0 = −2.2 nm. In this and the subsequent figure, as well as in all data analysis, the curve was not constrained to pass through the origin.

