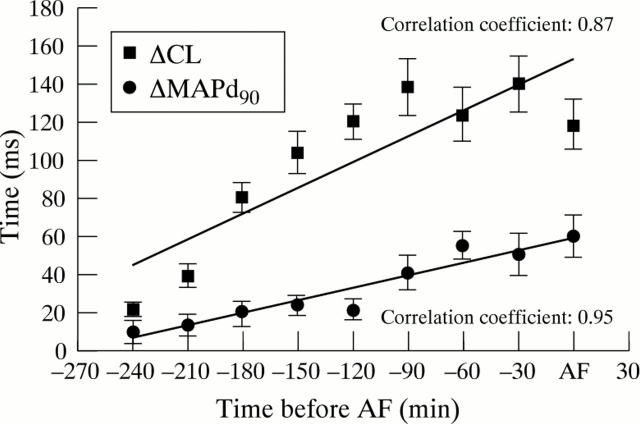
Figure 3 .
Changes in cycle length and monophasic action potential (MAP) duration variability and their linear correlation with the time interval before the onset of atrial fibrillation or flutter (AF). Error bars = SD. ΔCL, cycle length variability, ΔMAPd90, variability of monophasic action potential duration at 90% repolarisation.

