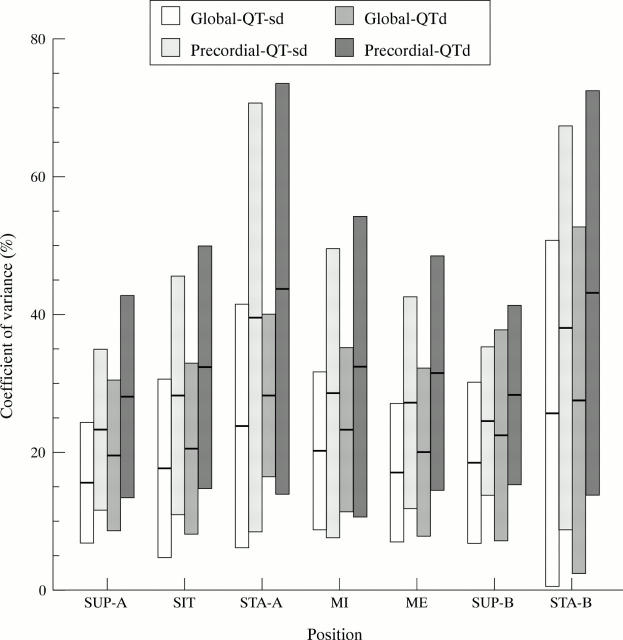
Figure 1 .
Mean values and standard deviations of coefficient of variance of QT dispersion measurements in the seven various positions. ME, ECG recordings on maximum expiration in study A; MI, ECG recordings on maximum inspiration in study A; SIT, ECG recordings when sitting in study A; STA-A/B, ECG recordings when standing in study A/B; SUP-A/B, ECG recordings in the supine position in study A/B.

