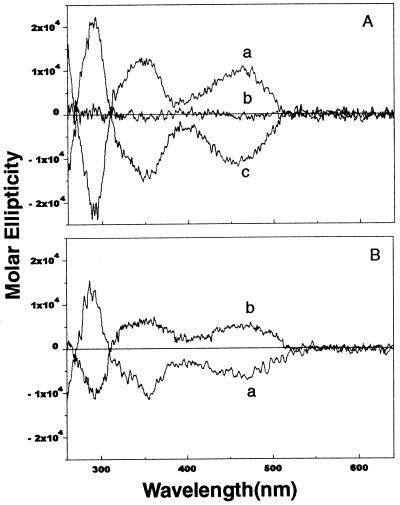
Figure 2.
CD spectra of daunorubicin and WP900 solutions. (A) Curve a, daunorubicin; curve c, WP900; curve b, a 1:1 molar ratio mixture of daunorubicin and WP900. (B) Curve a, CD spectrum of the dialysate after dialysis of the racemic mixture against B-form [poly(dGdC)]2 in 0.2 M NaCl. The dialysate is enriched in WP900, indicating preferential binding of daunorubicin to the right-handed DNA. Curve b, CD spectrum of the dialysate after dialysis of the racemic mixture against Z-form [poly(dGdC)]2 in 3.0 M NaCl. The dialysate is enriched in daunorubicin, indicating preferential binding of WP900 to the left-handed DNA. Details of the competition dialysis procedure are described in Materials and Methods.

