Figure 4 .

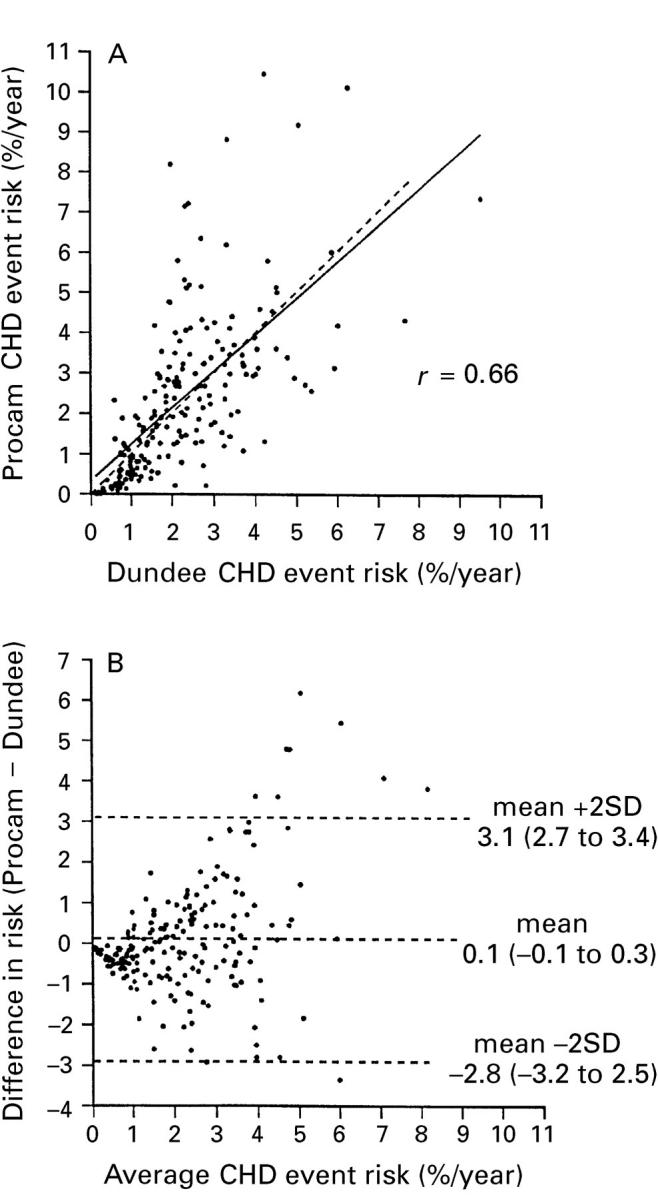
Individual risk estimates by the Dundee function v the PROCAM function. (A) Dashed line = line of identity; solid line = regression line. (B) Bland-Altman plot.

Individual risk estimates by the Dundee function v the PROCAM function. (A) Dashed line = line of identity; solid line = regression line. (B) Bland-Altman plot.