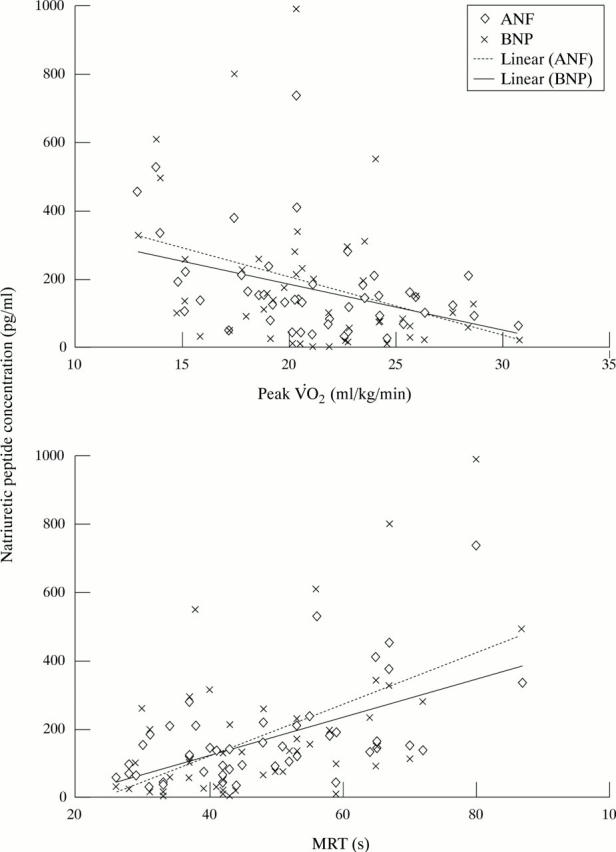
Figure 2 .

Scatterplot of peak oxygen consumption (V̇O2) (upper panel) and mean response time (MRT) of oxygen consumption at exercise onset to natriuretic peptides. The correlation of MRT to natriuretic peptides was closer (ANF, r = 0.59; BNP, r =0.53; p < 0.001) than the correlation of peak V̇O2 (ANF, r = −0.40, p < 0.01; BNP, r = −0.31, p < 0.05).
