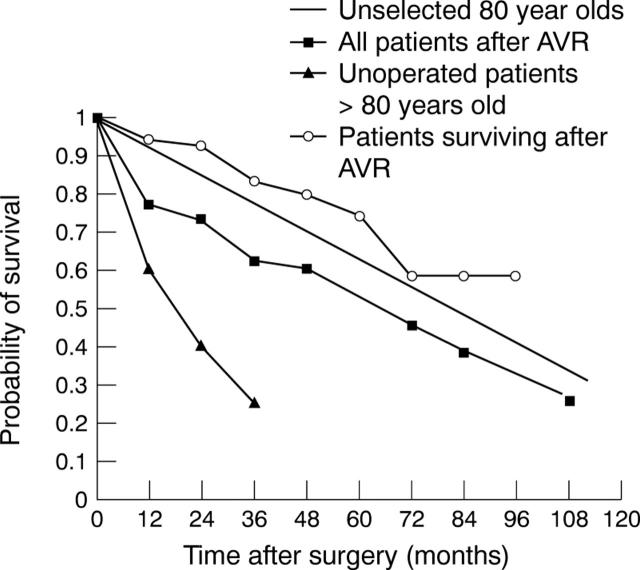
Figure 2 .
Comparison of outcome between our patients and historical controls. Data are shown for an unselected population of 80 year olds in the US3 and patients over 80 years old with symptomatic aortic stenosis8 (solid triangles). Data from our study has been superimposed to show both our total population (solid boxes) and the long term survival for patients surviving > 30 days postoperatively (open circles).

