
Figure 4 .
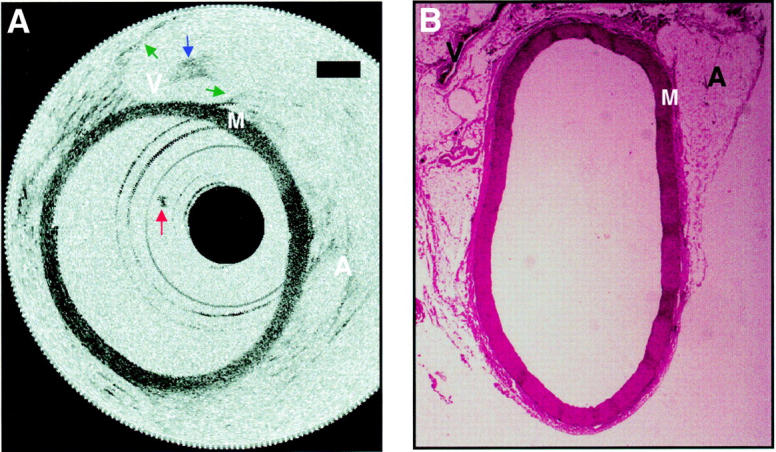
Aorta image after a saline flush and corresponding histology. (A) The media and surrounding supportive structures are clearly identified. The intima, which is less than 10 µm in diameter, cannot be detected in the images. Backscattering intensity is high in the media "M" and low in the adventitia "A", which consists primarily of loose connective tissue. A small clot adherent to the distal end of the catheter, which formed midway through imaging, is seen in many of the images (red arrow). A structure consistent with the inferior vena cava "V" is imaged through the wall of the aorta. The walls of the inferior vena cava are noted (green arrows), as well as a blood clot within (blue arrow). Bars represent 500 µm in all images. (B) Histology has been included to confirm tissue identification.