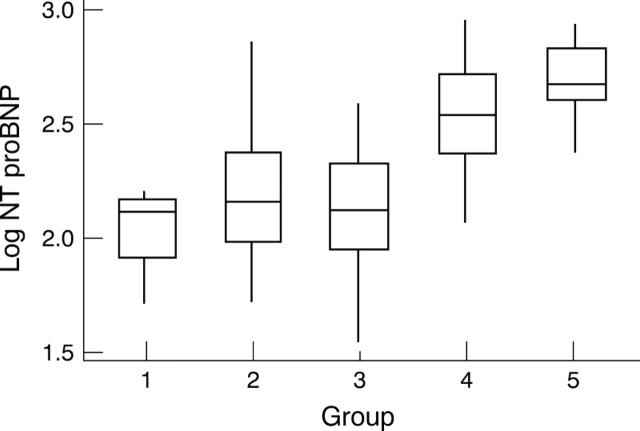
Figure 1 .
Box plot showing the relation between log NT proBNP concentrations and echocardiographic normal controls (group 1), patients with hypertension, normal left ventricular systolic function, and no LVH (group 2), patients with hypertension, normal left ventricular systolic function, and LVH (group 3), patients with a history of hypertension and left WMI between 1.9-1.3 (group 4), and patients with a history of hypertension and WMI of < 1.2 (group 5).

