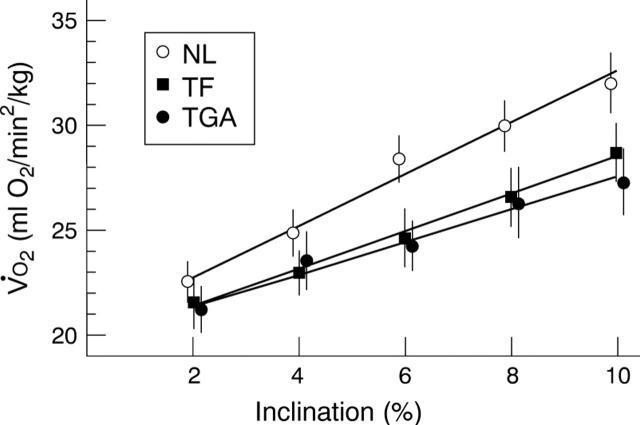
Figure 4 .
Slopes of oxygen uptake v exercise intensity (time) during graded treadmill exercise for normal controls (NL; open circles), patients after tetralogy of Fallot repair (TF; solid squares), and patients with transposition of the great arteries and atrial switch (TGA; solid circles). The slopes represent the mean value for each group compared for subsequent levels of exercise (inclination of the treadmill). Data collected during the first minute of exercise were omitted because of breathing irregularity at the onset of exercise. The data points represent average values and 95% confidence intervals of the mean for oxygen uptake (ml O2/min/kg).

