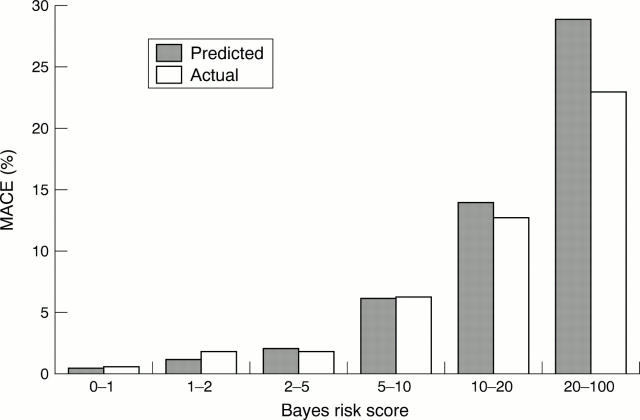
Figure 2 .
Bayes's risk groups were calculated from the development group and plotted against the incidence of major adverse cardiac events (MACE). These were compared against the actual event rate of MACE using the same risk groups created from the evaluation group. This calibration plot shows an accurate assessment of risk in the low risk groups, but it was less accurate for patients with greater risk.

