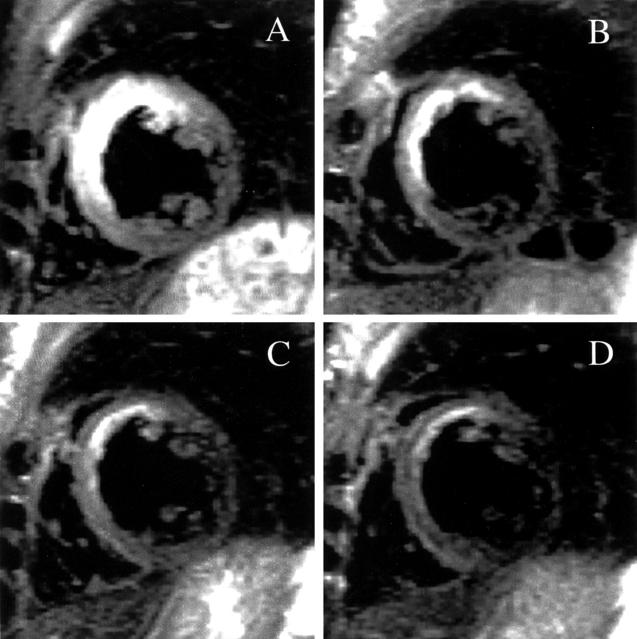
Figure 1 .
The course of postinfarction myocardial oedema (table 1, patient 9). Corresponding slices of the right and left ventricles positioned in the true short axis at mid-ventricular level from four succeeding examinations. (A) Seventh day post-myocardial infarction; (B) one month; (C) three months; (D) six months. The high signal intensity (bright) areas within the myocardium represent oedema. Notice the large extent of oedema on the seventh day affecting particularly the septum and anterior wall of the left ventricle, and the gradual decline of the oedema over the following months.

