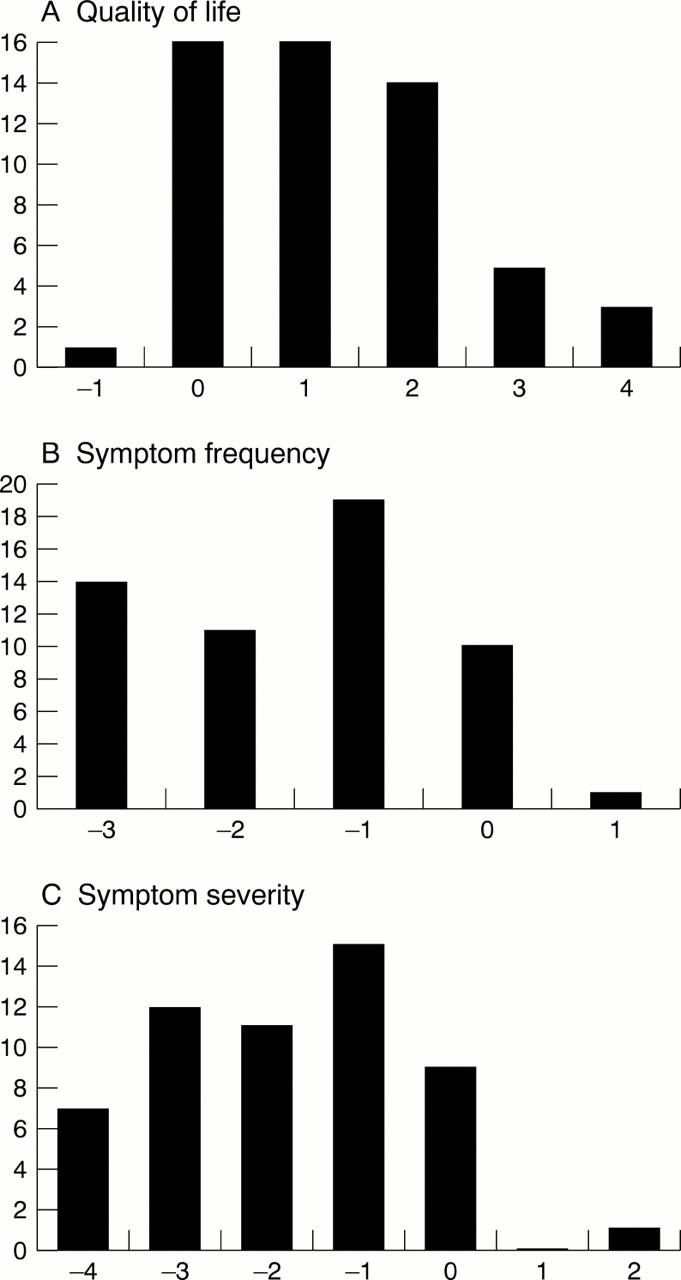
Figure 1 .

Changes in each patient's scores following ablation. Quality of life, symptom frequency, and symptom severity score changes are shown. An improvement in quality of life is denoted by positive values (A); a reduction in symptom frequency and severity following ablation is denoted by negative values (B, C). The time interval following ablation is compared with a similar time interval before ablation.
