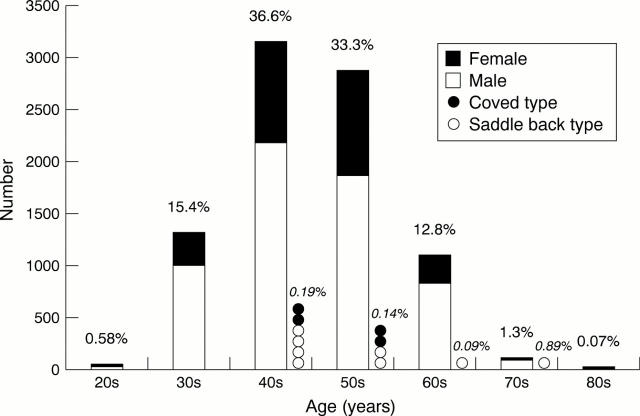
Figure 1 .
Bar graph showing age distribution of 8612 Japanese subjects in this study. Open and closed bars represent the male and female population in each generation, respectively. The number at the top of each bar is the percentage of the total population. Open and closed circles represent the subjects with saddle back and coved type ST shift, respectively. The number at the top of each circle is the percentage of the population by generation.

