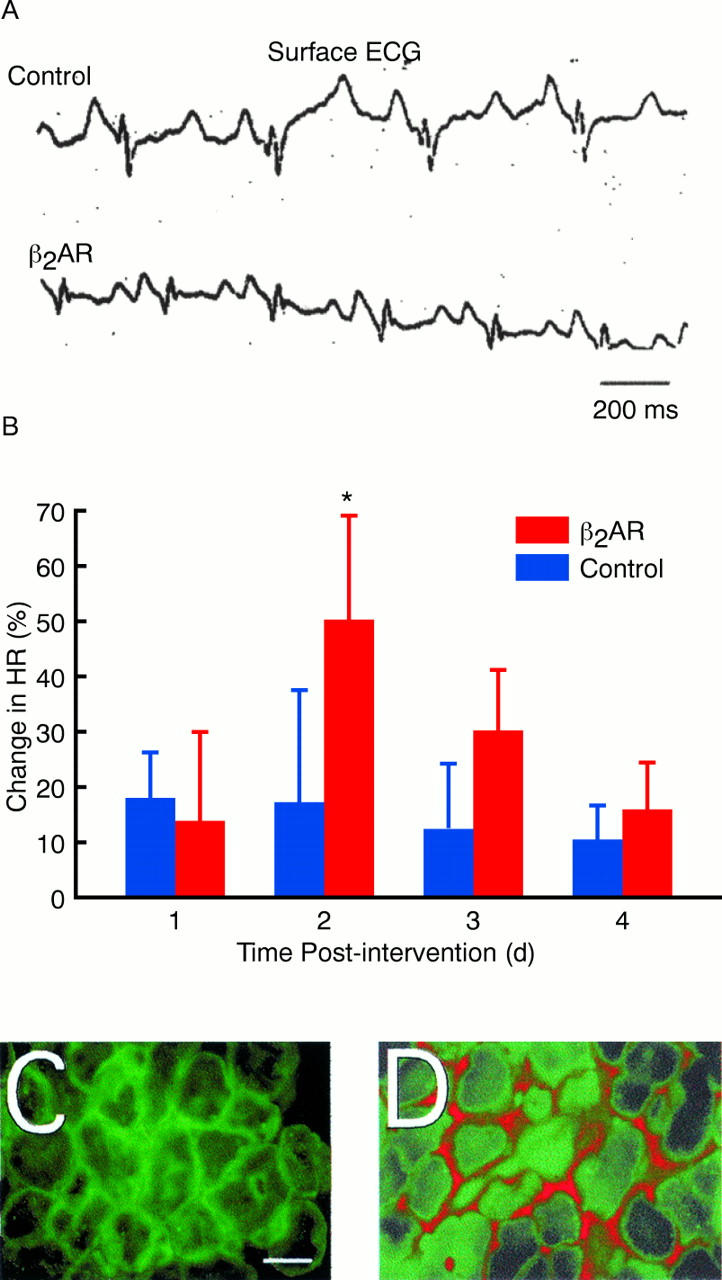
Figure 2 .

(A) Representative surface ECGs recorded 48 hours after injection of either control constructs or constructs encoding β2 adrenergic receptor. (B) The average percentage change in heart rate (HR) after injection of control construct or β2 adrenergic receptor (β2 AR) encoding plasmids (*p < 0.01 versus control). Dual fluorescence micrographs of sections of right atrial tissue co-injected with plasmids encoding green fluorescent protein and control constructs (C) and with the human β2 adrenergic receptor (D). Green fluorescent protein was visualised directly (green), and the human β2 adrenergic receptor was detected by immunostaining (red). Bar 32 µm.
