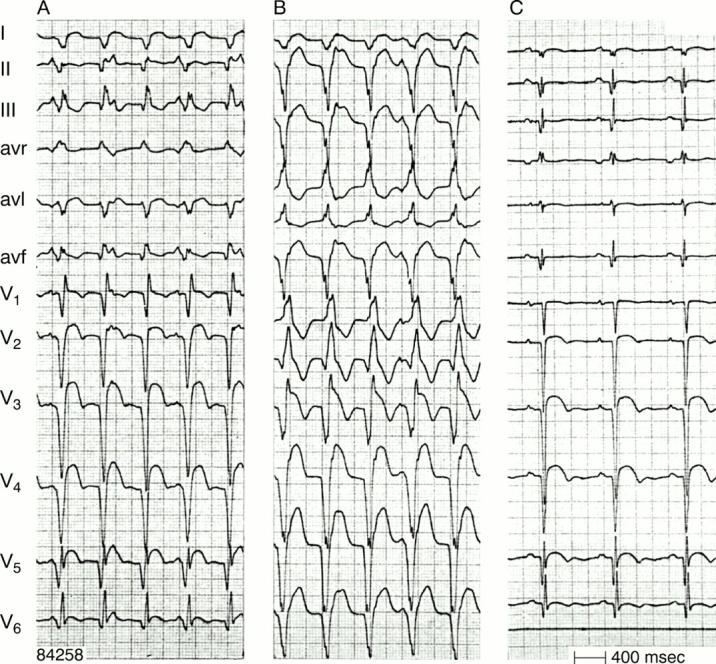
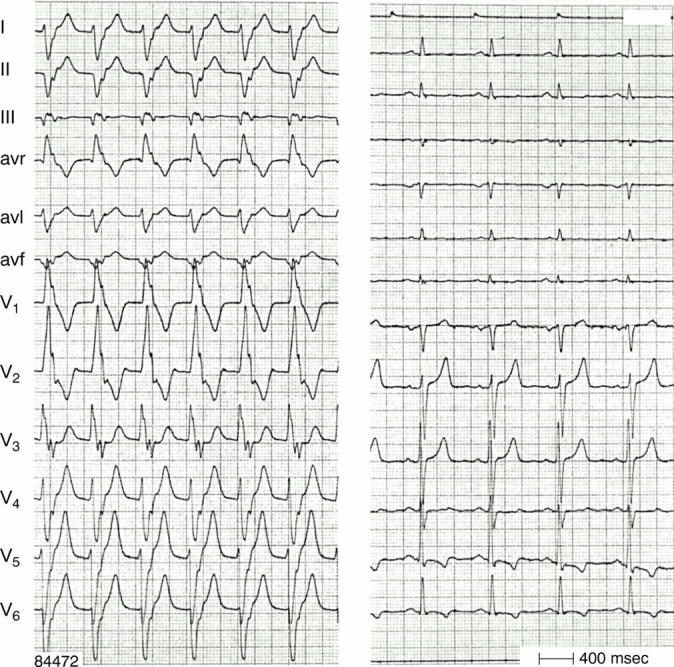
Figure 2: .


Two types of VT (panel A and B) in the same patient (panel C during sinus rhythm). Atrioventricular dissociation is present during both VTs. Note the effect of the frontal plane axis on the R:S ratio in lead V6 in RBBB shaped VT. R:S < 1 is present in case of a superior axis (panel B), but R:S > 1 with an inferior axis (panel A). Figure 3: One to one ventriculo-atrial conduction during VT. The p waves are negative in leads II, III, and avf and follow each QRS complex. Left panel—VT; right panel—same patient during sinus rhythm.
