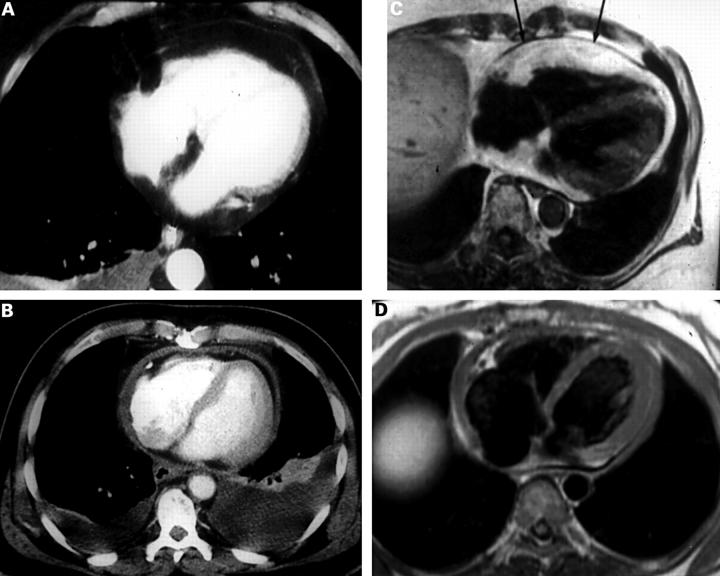
Figure 2 .
Normal and abnormal pericardium seen on computed tomography (CT) and magnetic resonance imaging (MRI) studies. (A) CT scan of normal pericardium. (B) CT scan of thickened pericardium. (C) MRI scan of normal thick pericardium (arrows). (D) MRI scan of a thickened pericardium. Reproduced from Breen18 with permission of Lippincott Williams & Wilkins.

