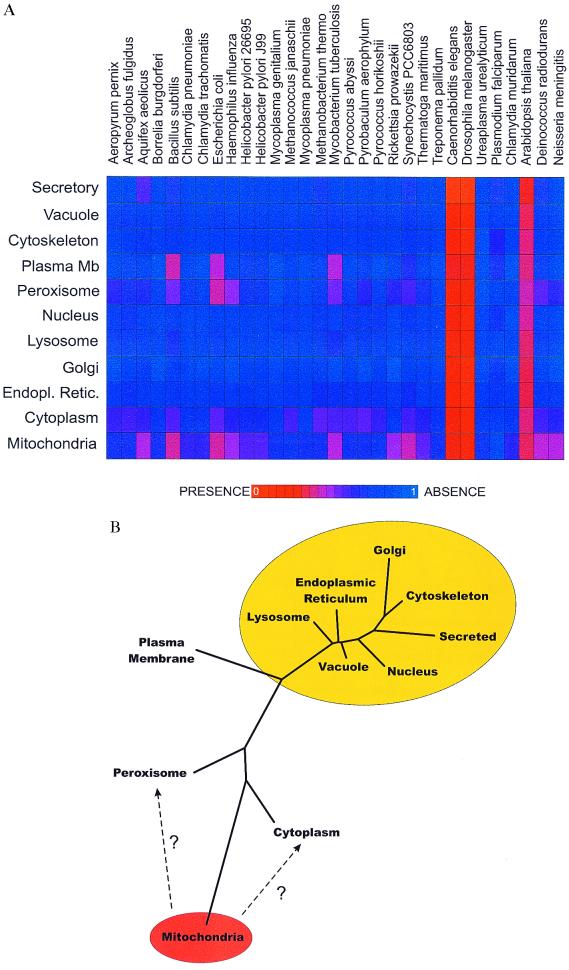
Figure 1.
(A) The mean phylogenetic profile (8) of yeast proteins experimentally localized (14) to different cellular locations. Each profile (a horizontal bar of 31 elements) shows the distribution among genomes of homologs of proteins from one subcellular location. Plasma Mb, plasma membrane. Colors express the average degree of sequence similarity of proteins in that organelle to their sequence homologs in the indicated genomes, with red indicating greater average similarity and blue indicating less, calculated as in the text. Only proteins with at least one homolog among the genomes listed are included. The genomes of Plasmodium and Arabidopsis are only partially complete (≈15% and 50%, respectively). (B) A tree of the observed relationships among the yeast proteins from different subcellular compartments. Overlaid on the tree is our interpretation of the relationships, showing ellipses clustering compartments thought to be derived from the progenitor of mitochondria (orange ellipse) and of the eukaryote nucleus (yellow ellipse). Only proteins with a homolog among the genomes listed in A are examined. A distance matrix was calculated of pairwise Euclidian distances between the mean phylogenetic profiles (A) of proteins known to be localized in each compartment. A tree was generated from this matrix by the neighbor-joining method implemented in PHYLIP 3.5C (J. Felsenstein, University of Washington, Seattle).

