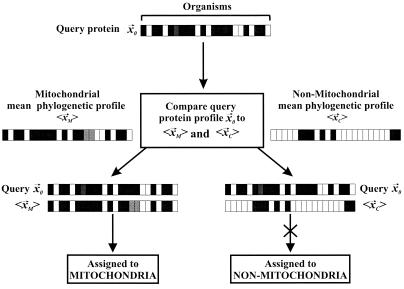
Figure 2.
The scheme by which proteins are classified into mitochondrial or nonmitochondrial cellular localizations. Each horizontal bar is a phylogenetic profile; that for the protein of interest x⃗0 is compared with the mean profiles for mitochondrial 〈x⃗1〉 and nonmitochondrial proteins 〈x⃗2〉 to determine its localization. In this example, the protein of interest is assigned to the mitochondrion because the query protein's phylogenetic profile more closely resembles the mean profile of mitochondrial proteins than the mean profile of cytosolic proteins.

