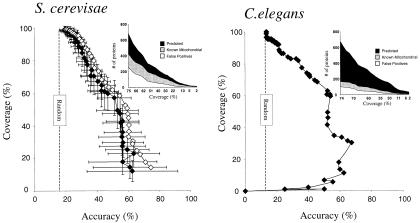
Figure 3.
Assignment of nuclear genome-encoded proteins to mitochondria. (Left) For yeast, a jackknife (♦ with error bars indicating ±1 SD) test on experimentally localized yeast proteins showing the method coverage (fraction of mitochondrial proteins correctly assigned) plotted versus the method accuracy (fraction of proteins assigned to mitochondria known to be mitochondrial). For comparison, results of a self-consistency test (⋄) are overlaid. (Inset) The (noncumulative) number of known (gray curve) and newly predicted (black curve) mitochondrial proteins for each coverage level, along with the number of known false positive predictions (white curve). One hundred jackknife trials were performed, randomly removing 10% of the proteins for each trial. The performance of a completely random classifier is shown as a vertical dashed line. (Right) Predicted localization of experimentally localized worm proteins by using yeast proteins as the training set. Axes are as in Left. (Inset) The number of worm proteins predicted to be mitochondrial, displayed as in Left. In both Left and Right, differing coverage and accuracy values were generated by varying the discrimination threshold (Δt) as described in Methods.

