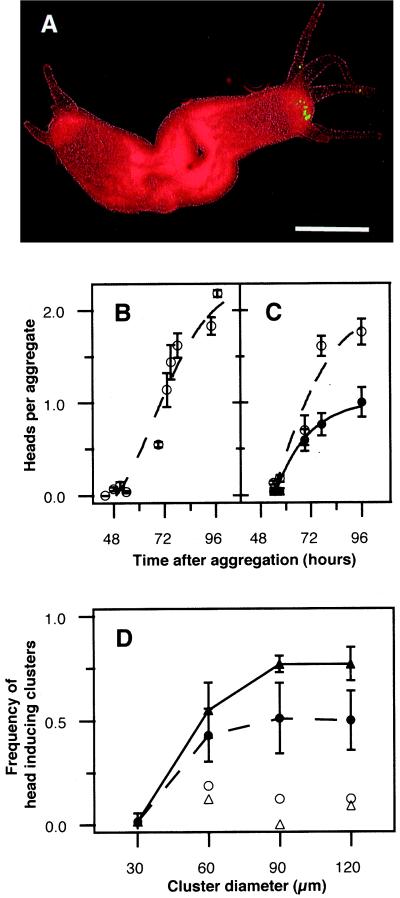
Figure 2.
Head induction by cell clusters. (A) A two-headed aggregate (96 h) with a head containing a green-labeled 60-μm cluster. (Bar = 200 μm.) (B) Time course of head formation in aggregates without introduced cell clusters. (C) Time course of the formation of heads containing 60-μm cell clusters (●) and total heads (○). Each data point is the mean ± SEM of 20–40 aggregates of three experiments. (D) Efficiency of cell clusters to induce head formation. Head formation frequency of single cells (30 μm) and different cell cluster sizes were scored 80 h after aggregation in carrier tissue derived from whole polyps (●; hatched line) and polyps lacking the upper fifth (▴; solid line) (P < 0.001, n = 28–53; means (SEM; three experiments). Control clusters derived from the corresponding carrier tissue are indicated by ○ and ▵.

