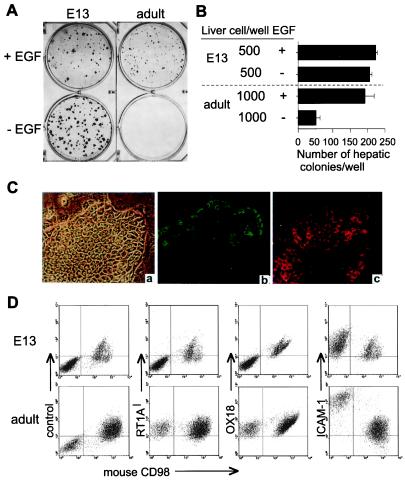
Figure 5.
Comparative analysis of hepatoblasts and highly proliferative hepatocytes. (A) Hepatoblasts from E13 liver or adult liver cells were cultured on STO feeders for 16 days then stained with Diff-Quik. (B) The colony number in the culture with or without EGF. The number of the hepatic colonies per well was counted from triplicate cultures. Data shown represent the means ± SD of triplicates. (C) Hepatic colony from adult liver (a–c). The micrographs of the phase contrast (a) and the double labeling with anti-AFP (b) and anti-ALB (c) are shown. Original magnification: ×200. (D) The surface analysis of cultured hepatoblasts and adult liver cells. Cultured cells were stained with mAbs, anti-RT1Al, OX18, or anti-ICAM-1. Mouse CD98 negative population represent rat cells.

