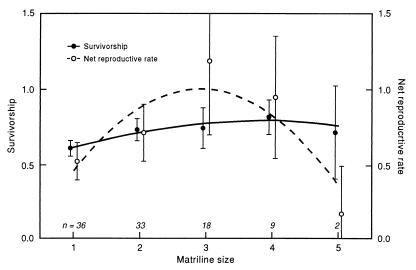
Figure 2.
The relationship between survivorship, net reproductive rate, and matriline size; n, number of years in which that matriline size occurred. Vertical bars indicate the 95% confidence intervals of the mean. For survivorship, Y = 0.460 + 0.179X −0.025X2, P = 0.008, R2 = 0.97. Differences among means were tested by one-way ANOVA, F4,93 = 2.75, P = 0.033; prior/posterior tests did not identify any group size as different from another. For Ro, Y = 0.158 + 0.751X −0.122X2, P = 0.0028, R2 = 0.12. One-way ANOVA (F4,93 = 4.44, P = 0.0025) was significant and a LSD test reveals that Ro was significantly lower for matrilines of 5 than for matrilines of 3.

