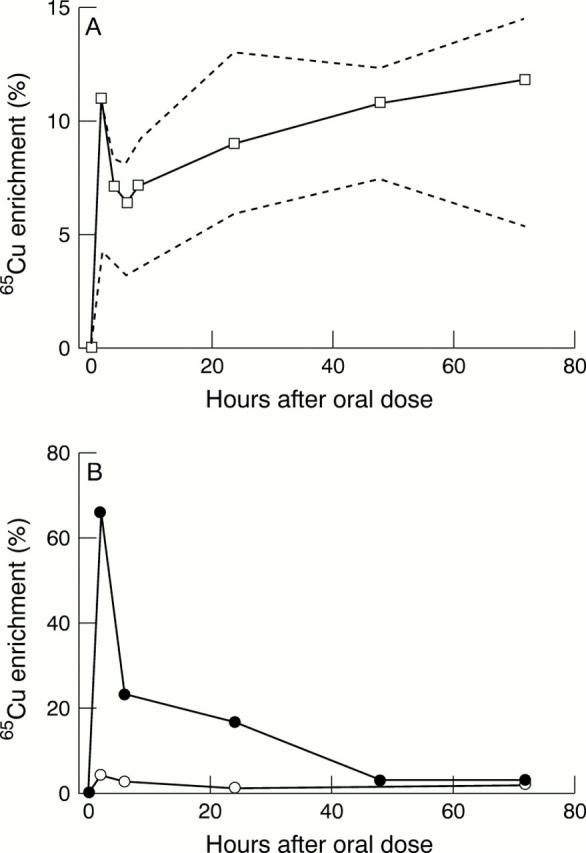
Figure 2 (A) Mean 65Cu enrichment time curve for serum after an oral dose of 65Cu in healthy control subjects. The broken lines give the upper and lower bounds. (B) 65Cu enrichment time curves for patients with Wilson's disease treated with penicillamine (filled circles) or with zinc (open circles). Note the difference in scale from panel (A).30
