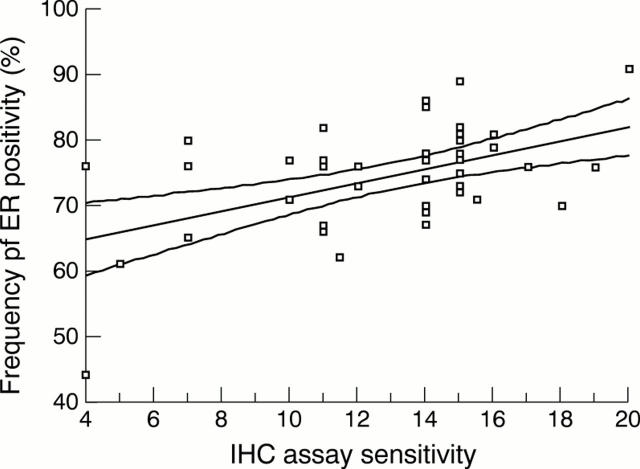
Figure 1 Scatter diagram to show the relation between the frequency of oestrogen receptor (ER) positivity in 46 laboratories and the immunohistochemical (ICH) assay sensitivity (median score achieved for assessment runs 40, 41, and 42). A least squares linear regression line is shown with 95% confidence interval, giving the best fit for all the data points. Spearman's correlation coefficient = 0.346, p = 0.019 (two tailed).

An official website of the United States government
Here's how you know
Official websites use .gov
A
.gov website belongs to an official
government organization in the United States.
Secure .gov websites use HTTPS
A lock (
) or https:// means you've safely
connected to the .gov website. Share sensitive
information only on official, secure websites.
