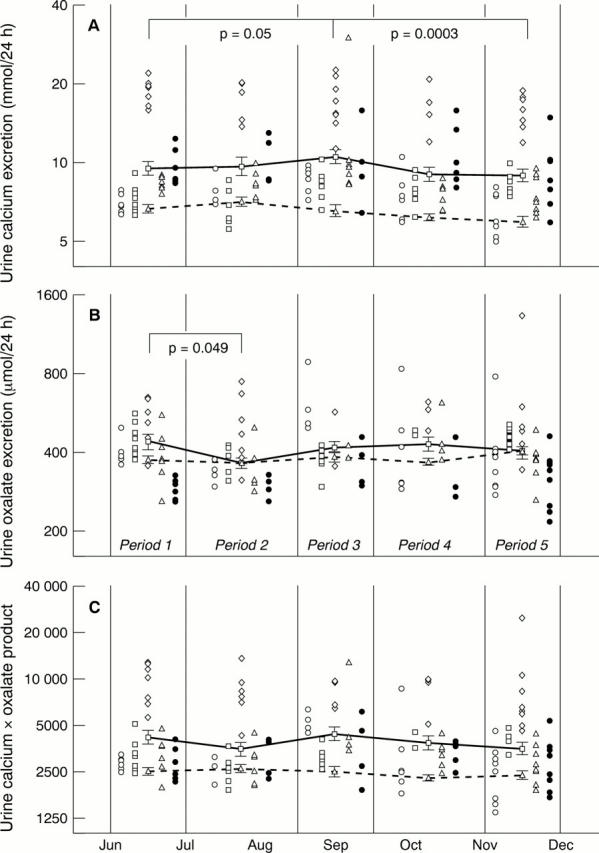
Figure 2 Patients' results showing log10 transformed values for 24 hour urine (A) calcium excretion, (B) oxalate excretion, and (C) the calcium times oxalate product excretion. The five patients' results are represented by open circles, open squares, open diamonds, open triangles, and filled circles, respectively. In the interests of clarity, individual patients' results during each stage of the trial are simply stacked one above the other, rather than being depicted chronologically. Separate patients' results are depicted side by side to assist in interpreting the data. The solid lines represent the overall mean patients' results for periods 1, 2, 3, 4, and 5 of the trial. Error bars represent 1 SE about the mean. The broken lines represent overall mean values of patients from the reference population, whose urine samples were collected during the same weeks of the year as the trial patients. Significant differences between periods are only shown for the trial patients and were calculated by two way analysis of variance, followed by the Fisher LSD test.
