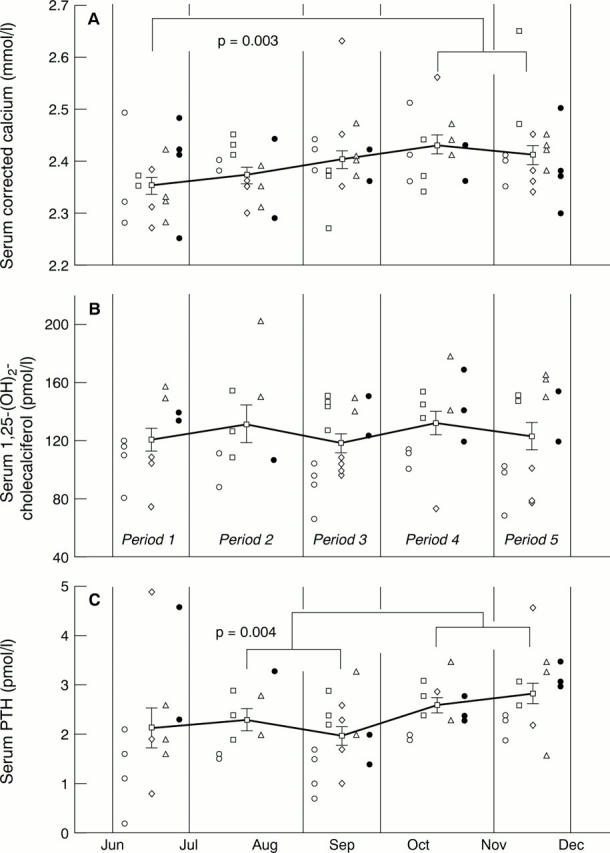
Figure 4 Pooled patients' results showing (A) serum calcium, (B) serum 1,25-(OH)2-cholecalciferol, and (C) serum parathyroid hormone (PTH). The five patients' results are represented by open circles, open squares, open diamonds, open triangles, and filled circles, respectively. In the interests of clarity, individual patients' results during each stage of the trial are simply stacked one above the other, rather than being depicted chronologically. Separate patients' results are depicted side by side to assist in interpreting the data. The solid lines show the mean results for periods 1, 2, 3, 4, and 5 of the trial. Error bars represent 1 SE about the mean. Significant differences between periods were calculated by two way analysis of variance, followed by the Fisher LSD test. For the purpose of statistical analysis, results for periods 2 and 3 (on calcium supplements) and periods 4 and 5 (off calcium supplements) were pooled.
