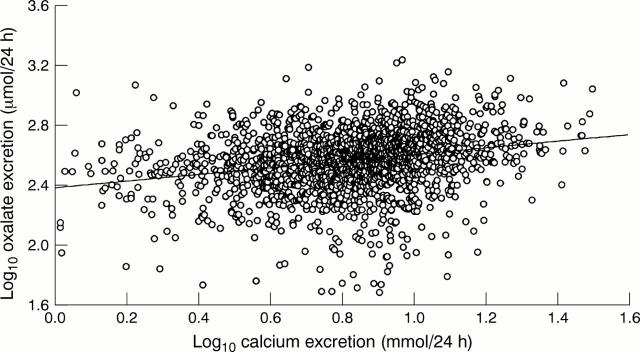
Figure 5 Scatter diagram of log 24 hour urine oxalate excretion against log calcium excretion on data from a group of 1066 urine collections from patients on follow up for previous renal stone disease. The regression parameter associated with the regression line was 0.155 (95% confidence interval, 0.045 to 0.266; p = 0.006).

An official website of the United States government
Here's how you know
Official websites use .gov
A
.gov website belongs to an official
government organization in the United States.
Secure .gov websites use HTTPS
A lock (
) or https:// means you've safely
connected to the .gov website. Share sensitive
information only on official, secure websites.
