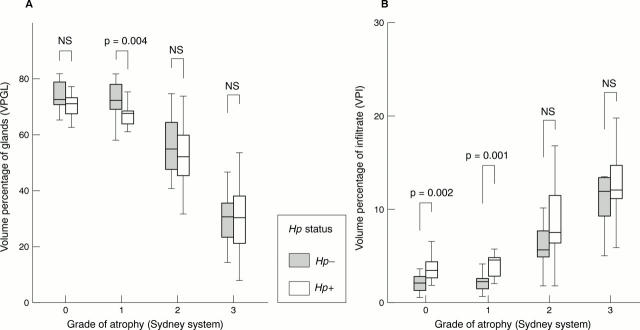
Figure 5 Volume percentage of glands (VPGL; A) and infiltrate (VPI; B) for different grades of atrophy according to the updated Sydney system in 124 gastric corpus biopsy specimens stratified by Helicobacter pylori (Hp) status. The Mann-Whitney U test was used to calculate the p values. Grade of atrophy: group 0, no atrophy; group 1, mild atrophy; group 2, moderate atrophy; group 3, pronounced atrophy. NS, not significant.

An official website of the United States government
Here's how you know
Official websites use .gov
A
.gov website belongs to an official
government organization in the United States.
Secure .gov websites use HTTPS
A lock (
) or https:// means you've safely
connected to the .gov website. Share sensitive
information only on official, secure websites.
