
Figure 2.
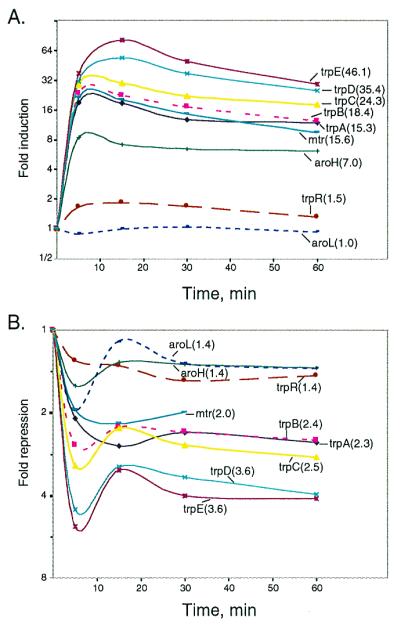
Dynamic changes in the mRNA levels for the genes in the five major trp repressor-regulated operons. (A) Tryptophan starvation (plus 10 μg/ml indole acrylic acid). (B) Tryptophan repression (plus 50 μg/ml l-tryptophan). Average magnitudes of changes in mRNA levels are shown in parenthesis.