
Figure 3.
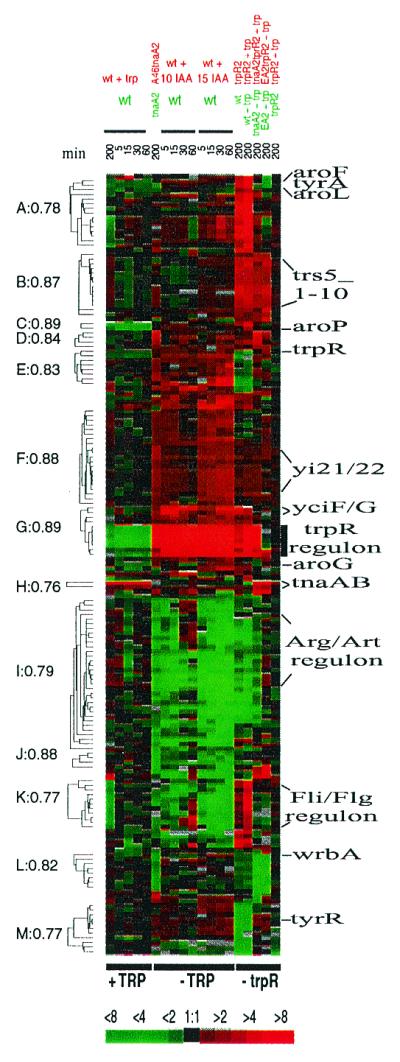
Hierarchical clustering of the 169 identified genes (see text). Correlation coefficients, r, are indicated to the left of the corresponding nodes. Selected genes are indicated to the right. A more complete version of this figure, corresponding ratio table, and complementary Table 4 can be found at http://genome-www.stanford.edu/tryptophan/Figure3_1.html.