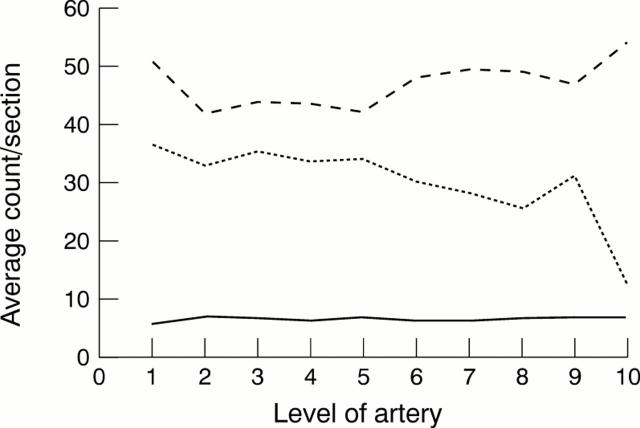
Figure 6 Graph showing the average count/section along the artery for elastic fibres (small dashes), collagen fibres (large dashes), and smooth muscle nuclei (continuous line). The changes along the vessel are clearly demonstrated and are most striking at the origin and as the vessel becomes intracranial.

An official website of the United States government
Here's how you know
Official websites use .gov
A
.gov website belongs to an official
government organization in the United States.
Secure .gov websites use HTTPS
A lock (
) or https:// means you've safely
connected to the .gov website. Share sensitive
information only on official, secure websites.
