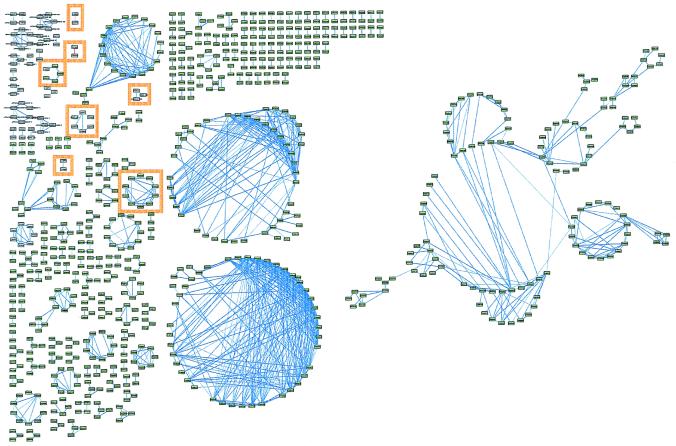
Figure 2.
Relevance networks constructed from the joined databases of baseline gene expression in 60 cancer cell lines and measures of susceptibility of the same cell lines to anticancer agents. The pairs of features (anticancer agents in green boxes, genes in white boxes) with r̂2 at or greater than ± 0.80 were drawn with line thickness proportional to r̂2. Features without an association at ± 0.80 were removed. Associations with negative r̂2 are in red. Seven networks are highlighted in orange and are in Table 1. Large versions of all figures and descriptions for each accession number may be found at http://www.chip.org/genomics.

