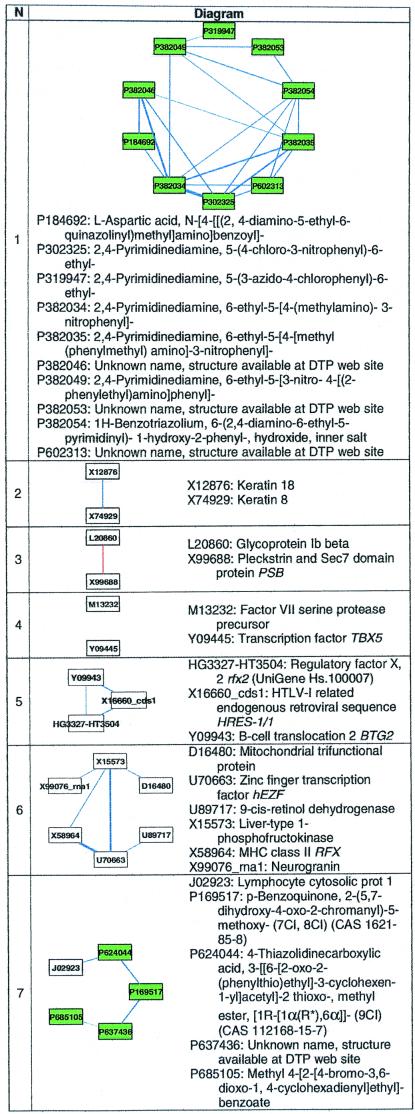
Table 1.
Seven relevance networks of the 202 from Fig. 2
The first network is an example of derivative associations, where several of the anticancer agents are slightly modified from each other. Networks 2–7 represent those found that demonstrate or potentially contain biological relationships. Several anticancer agents have no names and were listed only by accession number. Nodes representing measures of susceptibility to a single anticancer agent are shaded green and have labels starting with P. These labels correspond to the agent's National Cancer Institute NSC number. Nodes representing the expression levels of a single gene are in white; labels drawn within each node correspond to the RNA's GenBank accession code. Specific genes may be found by using the index at http://www.ncbi.nlm.nih.gov/Entrez/nucleotide.html, and anticancer agents may be found by NSC number by using http://dtp.nci.nih.gov/docs/dtp_search.html.

