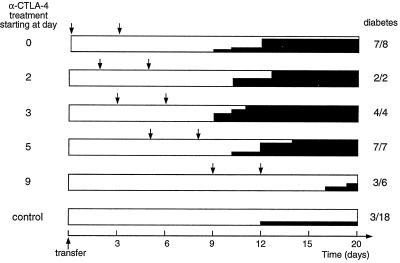
Figure 3.
Diabetes development after treatment with anti-CTLA-4 mAb initiated at various times. Cαo/o/NOD recipients of BDC2.5 splenocytes were treated with anti-CTLA-4 mAb (2 × 200 μg) or control mAb or PBS starting on different days after transfer, as listed on the left. Arrows indicate the times of anti-CTLA-4 injection; solid black shading shows the incidence of diabetes; and the numbers on the right represent the final diabetes frequency. Inexplicably, in a few experiments, all mice became diabetic, whether they were treated with anti-CTLA-4 or not; data from these experiments were excluded from the results shown above.

