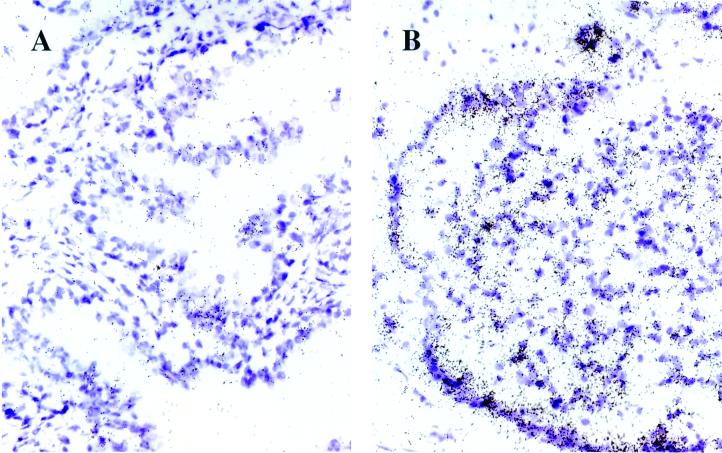
Figure 6.
PCGEM1 expression in normal and tumor areas of CaP tissues. In situ hybridization of 35S-labeled PCGEM1 riboprobe to matched normal (A) versus tumor (B) sections of patients with CaP. The purple areas are hematoxylin-stained cell bodies; the black dots represent the PCGEM1 expression signal. The signal is background level in the normal (A) and 2+ level in the tumor (B) section. The magnification is ×40.

