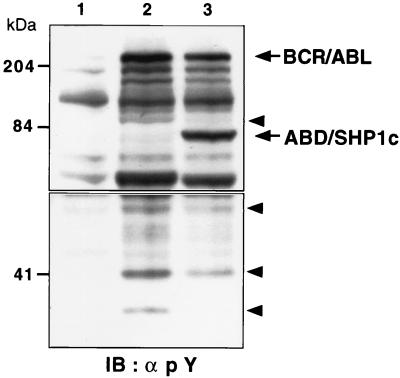
Figure 4.
Alterations in phosphotyrosine profile correlate with transformation suppression. Extracts from Rat1 cells mock-infected (lane 1), infected with p210 BCR/ABL virus (lane 2), or infected with an ABD/SHP1c and BCR/ABL virus (lane 3) were analyzed by immunoblot (IB) by using phosphotyrosine antibody. BCR/ABL and ABD/SHP1c are indicated with arrows. Bands with the greatest reduction in signal intensity are marked with arrowheads. Upper and lower panels are derived from different exposures of the same immunoblot. Molecular mass markers are presented at left.

