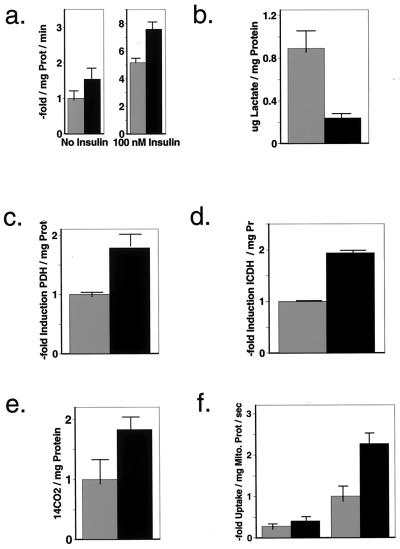
Figure 2.
Frataxin induces oxidative glucose metabolism by elevating mitochondrial calcium content. (a) Results of glucose transport assays performed with 3T3-L1-adipocytes expressing vehicle (light bars) or human frataxin (dark bars). Uptake of 3H-labeled 2-deoxy-glucose was measured by scintillation counting in the absence (left pair) and in the presence of insulin (100 nM, 60 min, right pair). The radioactivity in the cell lysates is proportional to the amount of glucose taken up normalized for protein content (100% equals 0.60 ± 0.08 nmol/min/mg protein). (b) Measurement of lactate within cell lysates normalized for protein content. The amount of this tricarbon intermediate and end product of anaerobic glycolysis is depicted in light bars for the vehicle transfected cells (0.89 ± 0.082 μg/mg protein) and dark bars for frataxin overexpressing cells. (c) Photometric quantification of pyruvate dehydrogenase activity in control cells (light bars) and frataxin overexpressing cells (dark bars) normalized for protein content, indicating an increased acetyl-CoA synthesis. (d) Activity of isocitrate dehydrogenase normalized for protein content in an set of cells identical to the above, indicating an up-regulated TCA cycle activity. (e) Production of radiolabeled 14CO2 subsequent to supplementing the cells with 14C-glucose, reflecting increased glucose oxidation. (f) Uptake of 45Ca2+ into isolated mitochondria in presence (left pair of bars) and absence (right pair of bars, light bar represents control [100%], which equals 0.026 ± 0.004 amol/mg mitochondrial protein/s) of ruthenium red, a specific blocker of the mitochondrial Ca2+ uniporter.

