Figure 6.
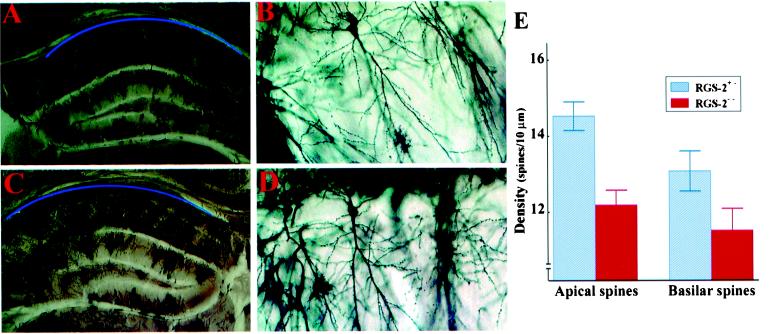
Reduced spine density in CA1 hippocampal neurons of rgs2−/− mice. (A–D) Histology of hippocampus of rgs2+/− (A and B) and rgs2−/− (C and D) mice. Blue lines demarcate the CA1 neuron region. Normal structure of the CA1 region in rgs2−/− mice. Golgi–Cox staining, ×4 and ×200. (E) Reduced numbers of spines in rgs2−/− CA1 neurons. Densities (spines/10 μm ± SD) of apical and basilar spines were determined by camera lucida. Differences in apical and basilar spine densities were statistically significant (t test, P < 0.005).

