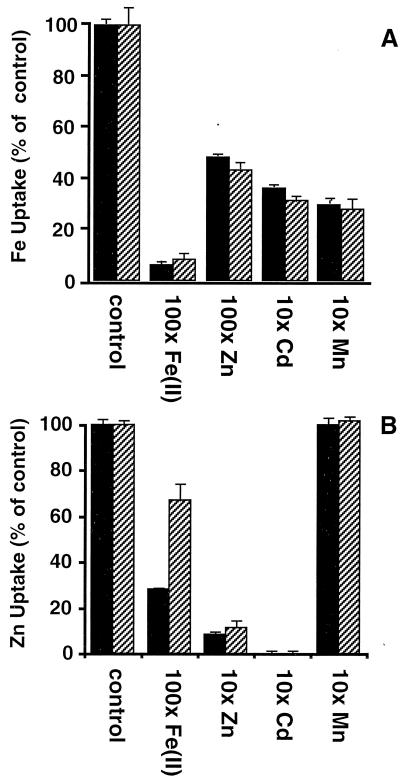
Figure 6.
(A) Competition of iron uptake. The indicated amount of FeCl3, ZnSO4, CdSO4, or MnCl2 was added to the uptake assay as described in Fig. 4A. Solid bars represent IRT1, and striped bars represent E103A. This experiment was performed twice; a representative data set is shown. (B) Competition of zinc uptake. The indicated amount of FeCl3, ZnSO4, CdSO4, or MnCl2 was added to the uptake assay as described in Fig. 4B. Solid bars represent IRT1, and striped bars indicate D100A. This experiment was performed twice; a representative data set is shown.

